


Red Book 1
Page 99
Pie Chart
B.
Vocabulary:
Reading Charts and Graphs
a.
A Pie Chart
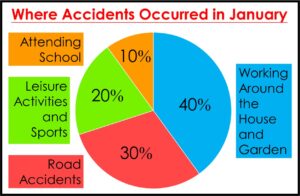
Many accidents occurred in January.
People who were in accidents
were taken to the Emergency Room
at City Hospital.
They became patients at City Hospital.
City Hospital made a pie chart
to share information
about their patients.
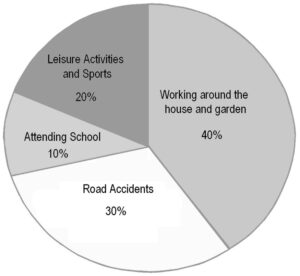
City Hospital Emergency Room
released this pie chart.
It shows where accidents
occurred in January.
Look at the chart.
Complete the sentences
that follow.
1.
Ten percent
of accidents occurred
while children were
attending school.
2.
Thirty percent
of the patients were in
road accidents.
3.
The least
accidents occurred
at school.
4.
Forty percent
of accidents occurred
in and around
people’s homes.
5.
Twenty percent
of accidents occurred
while people were
relaxing and having fun.