


Red Book 1
Page 99
Words
Vocabulary:
information
chart
A chart shows us information
in a picture.
A Fruit Chart
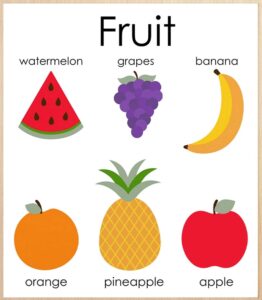
A chart is a picture.
A chart shows information
in a clear and organized way.
A chart helps us
understand information
at a glance.
graph
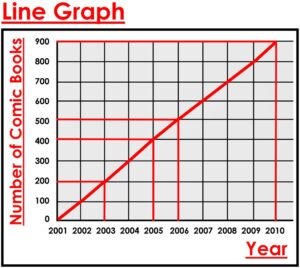
a line graph
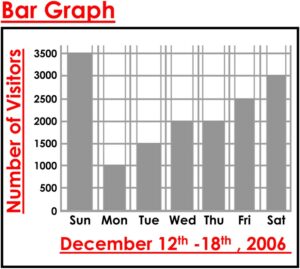
a bar graph
compare
Graphs often use numbers
to compare things.
Graphs can show information
using numbers.
Graphs can show
relationships between
different things.
All graphs are charts.
pie chart
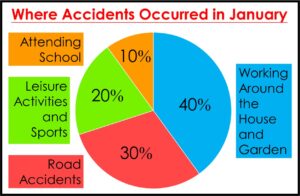
City Hospital Emergency Room
released a pie chart showing
where accidents occurred
patients
the least
the most
attending school
leisure activities
sports
road accidents
working around the house
working around the garden
Where accidents happened:
1.
Ten percent of accidents occurred
while children were attending school.
The least accidents occurred at school.
2.
Twenty percent of accidents occurred
while people were doing
leisure activities and sports.
Twenty percent of accidents occurred
while people were
relaxing and having fun.
3.
Thirty percent of accidents occurred
when people were in road accidents.
Thirty percent of patients
were in road accidents.
4.
Forty percent of accidents occurred
working around the house and
working around the garden
The most accidents occurred
in and around people’s homes